

PROJECT MANAGEMENT 101 AT WESTON & SAMPSON
MODULE 0
THE BUSINESS OF WESTON & SAMPSON ENGINEERS
Weston & Sampson applies technical knowledge and professional experience to the problems our clients bring to us, and value is created for our clients and for our firm when work is won, performed efficiently, and delivered to the expectations the client held at the outset. The project manager decides how that work is staffed, priced, and run, which makes the role central to our ability to create and capture value in the long run.
This module covers three subjects:
What Weston & Sampson sells and why our firm’s economics are driven primarily by labor.
How a project’s fee relates to Weston & Sampson’s economic model.
How fees and rates are built and how they relate to the Effective Labor Multiplier (ELM).
MODULE 0 PURPOSE AND SCOPE
Module 0 introduces Project Management 101 at Weston & Sampson. It sets out the economic model that measures every project.
WHERE THIS FITS
Module 0 · The Business of Weston & Sampson (you are here)
Module 1 · Project Pursuit
Module 2 · Scope
Module 3 · Schedule
Module 4 · Budgeting and Project Economics
Lesson objectives
After completing this lesson, a project manager will be able to:
- Describe what our consulting firm sells, and how the project manager influences performance.
- Understand the concepts of Revenue and Cost and the categories of Revenue and Cost that project managers interact with daily.
- Explain how Net Revenue breaks down to cover our core operating expenses and how Net Revenue turns into firm operating income.
- Demonstrate how our target ELM is built and how it relates to our rate and fee structure.
- Name the three factors that determine our firm's profitability, and which a project manager controls.
0.1 What Weston & Sampson sells
Weston & Sampson Engineers sells the professional knowledge and time of its staff to solve problems for our clients. Everything the Engineering firm earns is generated by the people who work here, so our economics rely almost entirely on labor. Since the Engineering Company does not currently hold an appreciable product line to ramp up or inventory to store, an hour that no one applies to a client’s problem today cannot be sold in a later period. This makes every staffing decision a project manager makes an economic decision that impacts the entire firm.
Weston & Sampson differs from firms of its size in two respects.
Breadth. Our single organization provides engineering, environmental, architectural, planning, and construction management capability. With those disciplines inside one organization, our firm can take a client’s problem from investigation through construction without a handoff.
Ownership. The people employed within the company own its stock. The margin well-managed work earns is retained by the staff who produced it. In addition, the work our firm has under contract and the work it expects to win affect the value of every employee’s stock, making the quality of our pursuit decisions relate directly to our firm’s value.
Remember: Weston & Sampson sells the knowledge and time of its people, and the project manager decides how both are allocated.
0.2 Firm and project economics
A small number of variables determine our firm's financial performance:
- The health of our fees,
- The efficiency with which our firm converts labor into Net Revenue, and
- The control of nonlabor () costs.
The decisions project managers make on individual projects affect all three.
0.2.1 Fees and Net Revenue
Weston & Sampson measures its labor economics against Net Revenue, which is defined as less (ODC):
- Gross Revenue, a project’s full fee, including ODC
- , the part of that fee our firm keeps
once the ODC are subtracted at cost.
Net Revenue = + ODC
Net Labor Revenue = Revenue generated by Weston & Sampson staff work.
Projected Gross Revenue − other direct costs (ODC) at cost = Net Revenue
ODC are the subconsultant, vendor, and amounts inside the revenue generated on a project. Because they are owed to another party, they pass through our firm without becoming earned revenue that we keep.
Some projects have no ODC. Where a project does include them, our firm applies a markup to the subconsultant and reimbursable costs at a target of 15 percent, applied at the project manager’s discretion. Some project types and clients permit no markup. The project manager verifies the markup allowance in the solicitation for each project and codifies any markup requirement or restriction in the proposal.
Take a roadway rehabilitation project with contract value of $400,000 (aka ), including a third-party geotechnical subconsultant for soil borings. The subconsultant’s own cost is $72,000, and a 15 percent markup on that cost is $10,800, so the client is billed $82,800 for the Geotechnical Engineer’s scope of work, packaged into Weston & Sampson’s fee.
The $400,000 fee therefore divides as follows:
- $400,000 Contract Value
- $72,000 of subconsultant cost, which passes through our firm,
- $10,800 of subconsultant cost markup, which our firm keeps, and
- $317,200 of fee that funds Weston & Sampson’s labor.
Net Revenue is therefore $328,000, the $317,200 of Net Labor Revenue plus the $10,800 markup our firm retains.
$400,000 Projected Gross Revenue − $72,000 subconsultant cost = $328,000 Net Revenue
Think of a project you have managed that had a large subconsultant or reimbursable amount. How much of that fee was available to fund Weston & Sampson labor?
Only the remainder, plus any markup applied. A team that plans its labor against Projected Gross Revenue is planning against money our firm never held.
0.2.2 The cost model
Net Revenue funds two categories of cost:
- , the effective unit salary cost of the staff performing the work or the raw labor cost associated with the project.
- Overhead, an allocation of our firm’s operating economics applied to each unit cost of project labor.
is what remains when direct labor and overhead are subtracted from the Net Revenue our firm recognizes on one project. When the profit from all our firm’s projects is aggregated to the firm level, the same measure is reported as . In a simplified format, it looks like this:
- Project Profit = Gross Revenue – ODC – Project Direct Labor – Overhead
- Operating Income = Sum of Project Profit for all projects
Overhead has two parts:
- , the cost of staff time not charged directly to a project. This includes overhead groups such as marketing, human resources and accounting.
- , including rent, computers and software, insurance, bonuses, and contributions to the employee stock ownership plan.
Overhead is most often expressed as a ratio of direct labor called the . The overhead rate states how many overhead dollars the firm spends for each direct labor dollar.
Our overhead rate varies from year to year based on our cost of doing business and is audited annually. For purposes of this text and for budgeting projects, we use an overhead rate of 1.85. The overhead rate adds overhead cost to the direct labor cost and that sum establishes the breakeven cost for a project. The is the multiple of direct labor at which Net Revenue recovers direct labor and overhead and yields no project profit. At a 1.85 overhead rate, that formula breaks down as:
$1.00 of direct labor + $1.85 of overhead = $2.85 of Net Revenue at breakeven
To create and sustain profitable performance, our firm must exceed our breakeven rate in the aggregate. We use a target Effective Labor Multiplier (), benchmarked against the overhead rate, to ensure our fee and performance targets are properly aligned. The ELM represents the ratio of Net Revenue to direct labor that we achieve for a person, for a project, or for the firm. The ELM varies from person to person, rate to rate, and project to project. Our goal is to control local ELM deviations such that, in the aggregate, Weston & Sampson achieves our performance target.
Our firm’s target ELM is 3.30, which means that we aim to earn $3.30 of Net Revenue for every $1 of Direct Labor that we charge to a project.
To further illustrate the economics, consider $185 of Net Labor Revenue generated from an employee with a $185/hour billing one hour to a project. Our target cost and profit model breakdown for that $185 would be:
- Direct Labor = $185 Net Labor Revenue / 3.30 ELM = $56.06 of direct labor,
- Overhead = $56.06 Direct Labor X 1.85 Overhead rate = $103.71 of overhead,
- Profit = $185 Net Labor Revenue - $103.71 overhead - $56.06 direct labor = $25.23 profit
- Check = $56.06 direct labor + $103.71 overhead + $25.23 profit = $185.00 Net Labor Revenue
0.2.3 Billing rates
The same model applies to the way our firm constructs billing rates. A billing rate is the hourly amount our firm charges to a project for one hour of a person’s time. Our billing rates are constructed such that projects, when completed using our standard billing rates and without writing off any portion of our costs incurred, will achieve at least our firm’s target ELM at completion.
We have several clients that have billing rates specific to their contracts. Those projects and clients are carefully selected such that their fee structures and overall workload volume support our firm’s performance target. The In Charge (PIC) approves any and any project ELM, billing rate, or profitability goal below the corporate target, including the use of unique fee structures for select clients.
Take an environmental scientist earning $72,800 a year. Unit hourly salary cost is what one hour of that person’s time costs our firm before overhead, derived by dividing the annual salary across 2,080 working hours. To find the billing rate at breakeven, multiply the unit hourly salary cost by the breakeven rate of 2.85. To find the billing rate at the target ELM, multiply it by 3.30.
$72,800 annual salary ÷ 2,080 hours = $35.00 salary cost per hour
$35.00 × 2.85 = $99.75 billing rate at breakeven
$35.00 × 3.30 = $115.50 billing rate at the target ELM
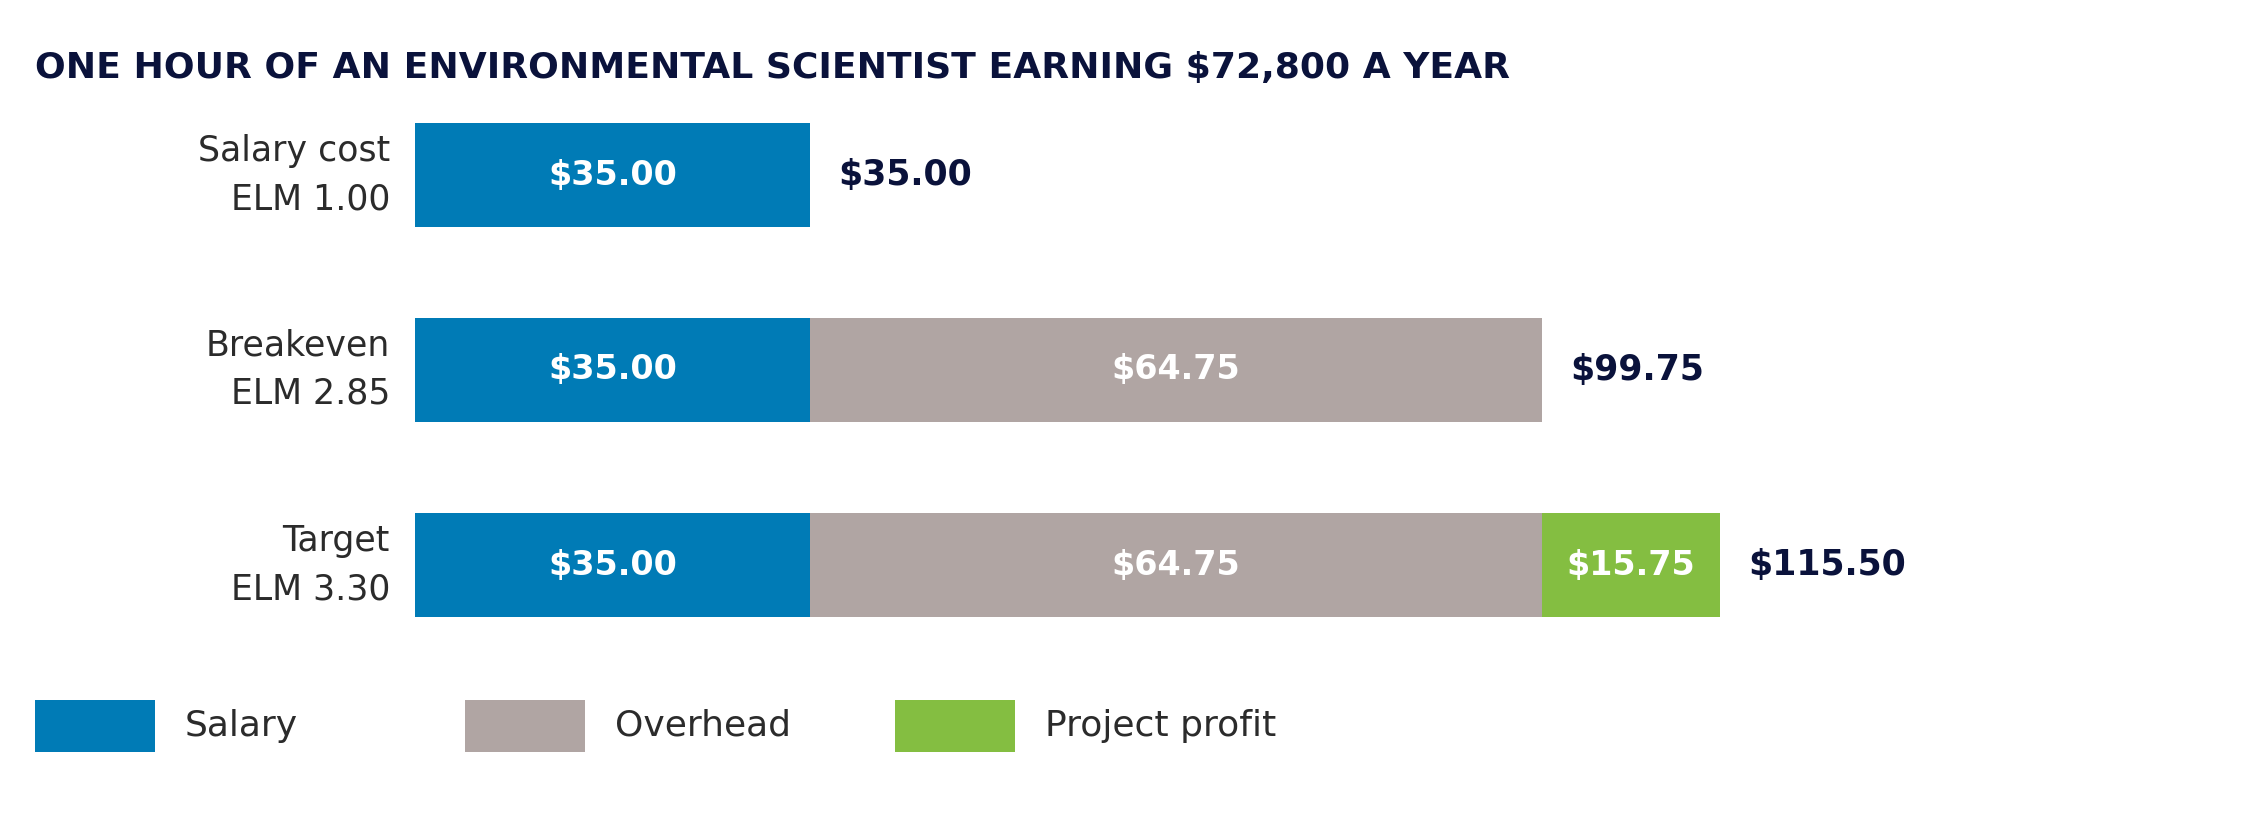
Every hour billed at the target rate of $115.50 returns $15.75 more than the hour costs our firm to deliver. Because the ratio is built on our overall firm’s economic model, the ratio holds at every scale. Our firm measures one hour of labor, one project’s fee, and a full year of performance with the same ELM target.
Our firm sets billing rates by four methods:
- A single multiplier applied to the whole project team,
- A multiplier applied with a manual override for named staff,
- A table of rates for specific staff or labor categories, and
- Our firm’s suggested rates, adjusted by the project manager and approved by the PIC.
Remember: A fee must clear the breakeven rate of 2.85 to cover direct labor and overhead, and an ELM of 3.30 meets our firm’s profitability target.
On projects and clients that use a billing rate table, more experienced staff often bill at an ELM below breakeven. We typically make up for this by having higher ELMs for the less experienced staff. The Project Manager must prepare a project cost plan to determine the overall project ELM when a billing rate table is used.
0.2.4 The metrics
Three metrics measure our firm’s performance, each focused on one element of our economic model:
- Revenue efficiency, measured by the Effective
Labor Multiplier (ELM),
ELM = Net Revenue ($) / Direct Labor ($)
- Labor efficiency, measured by ,
Utilization = Direct Labor ($) / Total Labor ($)
- Overhead efficiency, measured by the overhead
rate.
Overhead Rate = (Total Cost ($) - Direct Labor ($)) / Direct Labor ($)
Our goal is to maintain balance across these three metrics by:
- Winning the right projects at the right fees, priced to achieve our target ELM in aggregate.
- Maintaining the right to support staffing, holding the right work in the right disciplines to keep staff productive.
- Practicing non-labor cost stewardship, since every dollar of overhead raises the Net Revenue each direct labor dollar must produce.
Remember: The ELM, utilization, and the overhead rate measure our firm’s performance together. The pursuit decisions covered in the next sections require that the project manager consider the economic conditions that each Go/No-Go, scope, fee, and schedule decision create for the project they will ultimately manage.
0.3 Summary
Weston & Sampson creates value by converting employee knowledge and time into profitable client work. Project managers directly influence that value through the projects they pursue, the fees and rates they establish, the teams they assign, and the efficiency with which they deliver the work. Financial performance depends on balancing the , staff , and while selecting work that supports the firm’s target and profitability.
These economics begin taking shape before a project is won. During pursuit, the Go/No- determines whether a project’s client, scope, fee, schedule, and staffing demands can support both successful delivery and Weston & Sampson’s financial goals. This is where Module 1, Week 1 picks up.
Remember
- Weston & Sampson sells the knowledge and time of its people, and the project manager decides how both are allocated. Section 0.1
- A fee must clear the breakeven rate of 2.85 to cover direct labor and overhead, and an ELM of 3.30 meets our firm’s profitability target. Section 0.2
- The ELM, utilization, and the overhead rate measure our firm’s performance together. The pursuit decisions covered in the next sections require that the project manager consider the economic conditions that each Go/No-Go, scope, fee, and schedule decision create for the project they will ultimately manage. Section 0.2